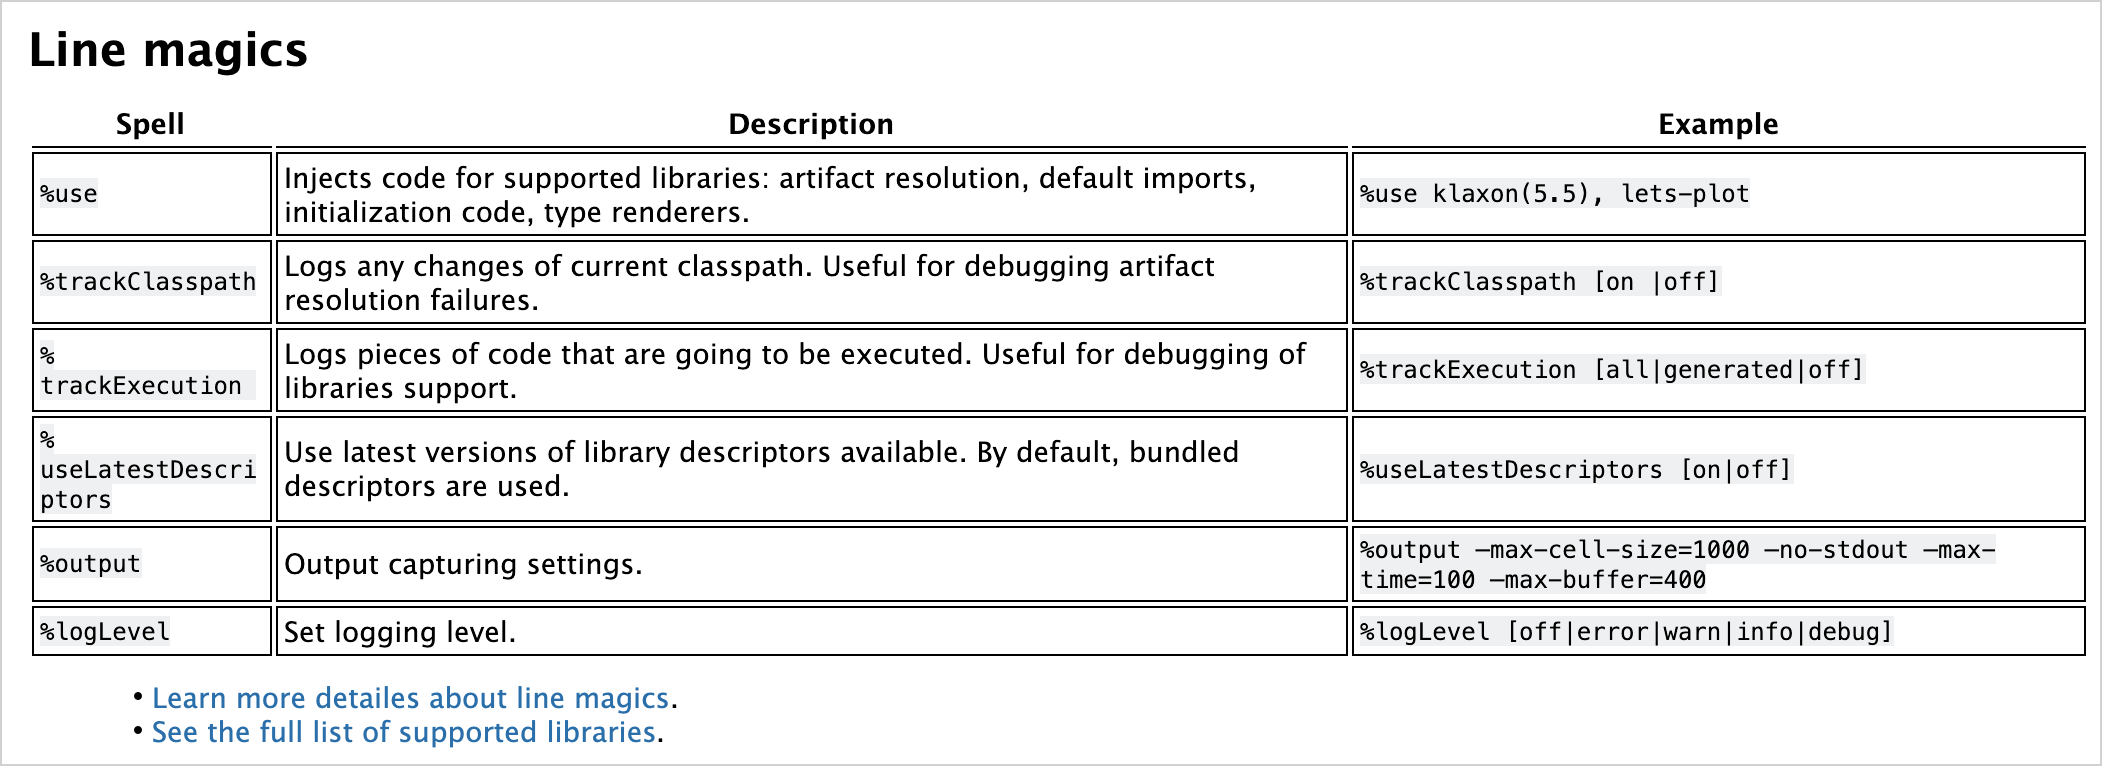
%use | Injects code for supported libraries: artifact resolution, default imports, initialization code, type renderers. | %use klaxon(5.5), lets-plot |
| %trackClasspath | Logs any changes of current classpath. Useful for debugging artifact resolution failures. | %trackClasspath [on |off] |
| %trackExecution | Logs pieces of code that are going to be executed. Useful for debugging of libraries support. | %trackExecution [all|generated|off] |
| %useLatestDescriptors | Use latest versions of library descriptors available. By default, bundled descriptors are used. | %useLatestDescriptors [on|off] |
| %output | Output capturing settings. | %output --max-cell-size=1000 --no-stdout --max-time=100 --max-buffer=400 |
| %logLevel | Set logging level. | %logLevel [off|error|warn|info|debug] |
```
## HTML
Kotlin Notebook 能够直接展现 HTML, 执行脚本, 甚至还能嵌入 Web 站点:
```
HTML("""
Counter: 0
""") ```  > **Note:** > 请在文件的最上部将你的 Notebook 标记为 Trusted, 这样才能执行脚本. ## 图片 使用 Kotlin Notebook, 你可以显示图片, 图片可以来自文件, 生成的图形, 或者任何其他视觉媒体. 可以显示各种格式的静态图片, 例如 `.png`, `jpeg`, 和 `.svg`. ### 缓冲的图片 默认情况下, 你可以使用 `BufferedImage` 类显示图片: ```KOTLIN import java.awt.Color import java.awt.image.BufferedImage val width = 300 val height = width val image = BufferedImage(width, height, BufferedImage.TYPE_INT_ARGB) val graphics = image.createGraphics() graphics.background = Color.BLACK graphics.clearRect(0, 0, width, height) graphics.setRenderingHint( java.awt.RenderingHints.KEY_ANTIALIASING, java.awt.RenderingHints.VALUE_ANTIALIAS_ON ) graphics.color = Color.WHITE graphics.fillRect(width / 10, height * 8 / 10, width * 10 / 20, height / 10) graphics.dispose() ```  ### 从外部加载的图片 通过使用 `lib-ext` 库, 你可以扩展标准的 Jupyter 的功能, 显示从网络加载的图片: ``` %use lib-ext(0.11.0-398) ``` ```KOTLIN Image("https://kotlinlang.org/docs/images/kotlin-logo.png", embed = false).withWidth(300) ```  ### 内嵌的图片 从网络加载图片的一个缺点是, 如果链接错误, 或者失去网络连接, 图片就会消失. 要解决这个问题, 请使用内嵌的图片, 例如: ```KOTLIN val kotlinMascot = Image("https://blog.jetbrains.com/wp-content/uploads/2023/04/DSGN-16174-Blog-post-banner-and-promo-materials-for-post-about-Kotlin-mascot_3.png", embed = true).withWidth(400) kotlinMascot ```  ## 数学公式和方程式 你可以使用 LaTeX 格式展现数学公式和方程式, 这是一种在学术界广泛使用的排版系统: 1. 添加 `lib-ext` 库, 它会向你的 Notebook 扩展 Jupyter Kernel 的功能: ``` %use lib-ext(0.11.0-398) ``` 2. 在新的 cell 中, 运行你的公式: ``` LATEX("c^2 = a^2 + b^2 - 2 a b \\cos\\alpha") ```  ## 数据帧(Data Frame) 使用 Kotlin Notebook, 你可以通过数据帧可视化结构化的数据: 1. 向你的 Notebook 添加 [Kotlin DataFrame](https://kotlin.github.io/dataframe/home.html) 库: ``` %use dataframe ``` 2. 在新的 cell 中, 创建数据帧, 并运行它: ```KOTLIN val months = listOf( "January", "February", "March", "April", "May", "June", "July", "August", "September", "October", "November", "December" ) // 各种产品/各个月份的销售数据: val salesLaptop = listOf(120, 130, 150, 180, 200, 220, 240, 230, 210, 190, 160, 140) val salesSmartphone = listOf(90, 100, 110, 130, 150, 170, 190, 180, 160, 140, 120, 100) val salesTablet = listOf(60, 70, 80, 90, 100, 110, 120, 110, 100, 90, 80, 70) // 一个数据帧, 包含 Month, Sales, 和 Product 的列 val dfSales = dataFrameOf( "Month" to months + months + months, "Sales" to salesLaptop + salesSmartphone + salesTablet, "Product" to List(12) { "Laptop" } + List(12) { "Smartphone" } + List(12) { "Tablet" }, ) ``` 这个数据帧使用 `dataFrameOf()` 函数, 包含几种产品 (笔记本电脑, 手机, 以及平板电脑) 在 12 个月内的销售数量. 3. 浏览你的数据帧中的数据, 例如, 查找销售数量最高的产品和月份: ``` dfSales.maxBy("Sales") ```  4. 你也可以将你的数据帧导出为 CSV 文件: ```KOTLIN // 将你的数据导出为 CSV 格式 dfSales.writeCSV("sales-stats.csv") ``` ## 图表 你可以在你的 Kotlin Notebook 中直接创建各种图表, 来可视化你的数据: 1. 向你的 Notebook添加 [Kandy](https://kotlin.github.io/kandy/welcome.html) 绘图库: ``` %use kandy ``` 2. 在新的 cell 中使用同一个数据帧, 运行 `plot()` 函数: ```KOTLIN val salesPlot = dfSales.groupBy { Product }.plot { bars { // 访问数据帧的列, 用于 X 轴和 Y 轴 x(Month) y(Sales) // 访问数据帧的列, 用于分组, 并为这些分组设置颜色 fillColor(Product) { scale = categorical( "Laptop" to Color.PURPLE, "Smartphone" to Color.ORANGE, "Tablet" to Color.GREEN ) legend.name = "Product types" } } // 定制图表的外观 layout.size = 1000 to 450 layout.title = "Yearly Gadget Sales Results" } salesPlot ```  3. 你也可以将你的图表导出为 `.png`, `jpeg`, `.html`, 或 `.svg` 格式: ```KOTLIN // 为图表文件指定输出格式: salesPlot.save("sales-chart.svg") ``` ## 下一步做什么 * [使用 DataFrame 和 Kandy 库进行数据可视化](data-analysis-visualization.html) * [详细了解在 Kotlin Notebook 中渲染和显示富格式输出(rich output)](https://www.jetbrains.com/help/idea/kotlin-notebook.html#render-rich-output) * [从 CSV 和 JSON 文件获取数据](data-analysis-work-with-data-sources.html) * [查看推荐的库](data-analysis-libraries.html)